Introduction
Joule Profiler is a tool for measuring program metrics from various sources, such as RAPL, perf_event or NVML, with a focus on energy consumption. It supports profiling CPU, GPU, and other system metrics at multiple scopes. Its modular and extensible architecture, written in Rust, allows new sources to be added easily, while minimizing overhead to provide reliable measurements.
It can be used through the CLI or via the exposed library, which offers more flexible configuration and the ability to add user-defined sources. Some traits are exposed through the crate API, enabling users to implement custom metric sources easily.
The supported hardware and systems depend on the sources you choose. Refer to each source’s documentation for details.
Joule Profiler is heavily inspired by JouleIt1 but provides enhanced features and is written in Rust for better performance, safety, portability, and extensibility.
Phases
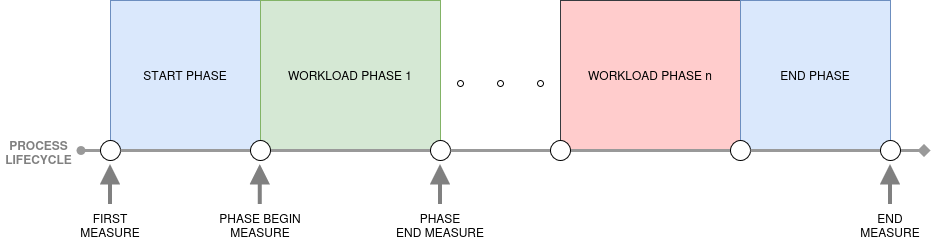
The main feature that distinguishes Joule Profiler from other profilers such as Alumet2 or Scaphandre3 is its phases. It enables energy profiling on different parts of a program, called phases, allowing to identify which sections of execution contribute most to energy consumption.
Phases are detected via tokens printed to standard output and matched with a configurable regular expression. This approach may introduce overhead and noise depending on the system’s I/O performance.
In the future, we may implement an alternative using inter-process communication with language-specific wrappers to reduce the overhead introduced.