Introduction
Joule Profiler is a tool for measuring program metrics from various sources, such as RAPL, perf_event or NVML, with a focus on energy consumption. It supports profiling CPU, GPU, and other system metrics at multiple scopes. Its modular and extensible architecture, written in Rust, allows new sources to be added easily, while minimizing overhead to provide reliable measurements.
It can be used through the CLI or via the exposed library, which offers more flexible configuration and the ability to add user-defined sources. Some traits are exposed through the crate API, enabling users to implement custom metric sources easily.
The supported hardware and systems depend on the sources you choose. Refer to each source’s documentation for details.
Joule Profiler is heavily inspired by JouleIt1 but provides enhanced features and is written in Rust for better performance, safety, portability, and extensibility.
Phases
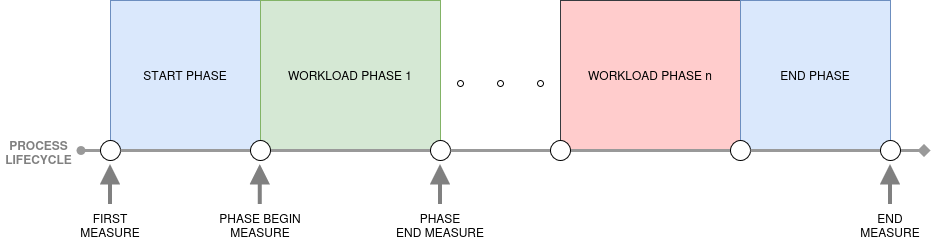
The main feature that distinguishes Joule Profiler from other profilers such as Alumet2 or Scaphandre3 is its phases. It enables energy profiling on different parts of a program, called phases, allowing to identify which sections of execution contribute most to energy consumption.
Phases are detected via tokens printed to standard output and matched with a configurable regular expression. This approach may introduce overhead and noise depending on the system’s I/O performance.
In the future, we may implement an alternative using inter-process communication with language-specific wrappers to reduce the overhead introduced.
Quick Start
Getting started with Joule Profiler is easy and straightforward.
First, install the latest version:
curl -fsSL https://raw.githubusercontent.com/joule-profiler/joule-profiler/main/install.sh | bash
Basic Measurement
The simplest way to measure energy consumption is to run your program with the profiler:
joule-profiler profile -- ./my-program arg1 arg2
This will execute your program and display energy consumption metrics in the terminal once it completes:
╔════════════════════════════════════════════════╗
║  Command                                       ║
╚════════════════════════════════════════════════╝
  python3 main.py
 ────────────────────────────────────────────────
  Duration            :       3013 ms
  Exit code           :          0

╔════════════════════════════════════════════════╗
║  Phase: START -> END                           ║
╚════════════════════════════════════════════════╝
  Duration            :       3013 ms
  Start token         :      START
  End token           :        END

┌────────────────────────────────────────────────┐
│ RAPL (perf_event)                              │
└────────────────────────────────────────────────┘
  CORE-0              :    7299194 µJ
  PACKAGE-0           :   15104492 µJ
  PSYS                :   35101074 µJ
  UNCORE-0            :     355224 µJ
Phases
Put some prints separating your program’s parts:
...

print("__SETUP_PHASE__", flush=True)

setup()

print("__WORKLOAD_PHASE__", flush=True)

workload()

print("__CLEANUP_PHASE__", flush=True)

cleanup()

...
Don’t forget to flush the standard output after each print, see troubleshooting.
Now, lauch Joule Profiler:
joule-profiler profile -- ./my-program arg1 arg2
You will get something like:
__SETUP__
__WORKLOAD__
__CLEANUP__
╔════════════════════════════════════════════════╗
║  Command                                       ║
╚════════════════════════════════════════════════╝
  python3 main.py
 ────────────────────────────────────────────────
  Duration            :       3013 ms
  Exit code           :          0

╔════════════════════════════════════════════════╗
║  Phase: START -> __SETUP__                     ║
╚════════════════════════════════════════════════╝
  Duration            :         10 ms
  Start token         :      START
  End token           : __SETUP__ (line 0)

┌────────────────────────────────────────────────┐
│ RAPL (perf_event)                              │
└────────────────────────────────────────────────┘
  CORE-0              :     184997 µJ
  PACKAGE-0           :     226806 µJ
  PSYS                :     387084 µJ
  UNCORE-0            :       4150 µJ

╔════════════════════════════════════════════════╗
║  Phase: __SETUP__ -> __WORKLOAD__              ║
╚════════════════════════════════════════════════╝
  Duration            :       1000 ms
  Start token         : __SETUP__ (line 0)
  End token           : __WORKLOAD__ (line 1)

┌────────────────────────────────────────────────┐
│ RAPL (perf_event)                              │
└────────────────────────────────────────────────┘
  CORE-0              :    1856750 µJ
  PACKAGE-0           :    3949645 µJ
  PSYS                :    8571228 µJ
  UNCORE-0            :      85571 µJ

╔════════════════════════════════════════════════╗
║  Phase: __WORKLOAD__ -> __CLEANUP__            ║
╚════════════════════════════════════════════════╝
  Duration            :       1000 ms
  Start token         : __WORKLOAD__ (line 1)
  End token           : __CLEANUP__ (line 2)

┌────────────────────────────────────────────────┐
│ RAPL (perf_event)                              │
└────────────────────────────────────────────────┘
  CORE-0              :    1398742 µJ
  PACKAGE-0           :    3311218 µJ
  PSYS                :    7377380 µJ
  UNCORE-0            :      58105 µJ

╔════════════════════════════════════════════════╗
║  Phase: __CLEANUP__ -> END                     ║
╚════════════════════════════════════════════════╝
  Duration            :       1003 ms
  Start token         : __CLEANUP__ (line 2)
  End token           :        END

┌────────────────────────────────────────────────┐
│ RAPL (perf_event)                              │
└────────────────────────────────────────────────┘
  CORE-0              :    1468383 µJ
  PACKAGE-0           :    3395080 µJ
  PSYS                :    7314697 µJ
  UNCORE-0            :     137817 µJ
Custom Output Format
By default, the output is shown in the terminal with a human-readable format. For further analysis or integration with other tools, you can export results in different formats:
# Export results as JSON for programmatic analysis
joule-profiler --json profile -- ./my-program

# Export results as CSV for spreadsheet analysis
joule-profiler --csv profile -- ./my-program
An output file will be generated at the end of the profiling. These formats make it easy to process results with scripts or import them into visualization tools.
Additional Options
Specify an Output File
You can choose where to export your results:
# Save results to a file (format determined by extension or --json/--csv flags)
joule-profiler -o results.json --json profile -- ./my-program
This is particularly useful when running multiple benchmarks.
GPU Profiling
If your system has an Nvidia GPU and you want to measure GPU energy consumption alongside CPU:
# Include GPU metrics in the measurement
joule-profiler --gpu profile -- ./my-program
Performance Counters
Joule Profiler supports perf_event performance counters on Linux systems, you can activate this feature with the --perf flag.
joule-profiler --perf profile -- ./my-program
GPU profiling requires the NVML library (part of NVIDIA driver installation).
Choosing RAPL Backend
By default, Joule Profiler measures RAPL counters using either perf_event (default) or Powercap backend depending on your system.
You can explicitly choose which backend to use:
# Use Powercap backend (requires root)
sudo joule-profiler --rapl-backend=powercap profile -- ./my-program

# Use perf_event backend (lower overhead, may require kernel configuration)
joule-profiler --rapl-backend=perf profile -- ./my-program
The choice of backend can affect measurement granularity and permission requirements. See the RAPL documentation for details on each backend.
For more advanced usage including phase-based profiling, iterations, and custom metric sources, see the examples folder.
Quick Install
Install the latest version with a single command:
curl -fsSL https://raw.githubusercontent.com/joule-profiler/joule-profiler/main/install.sh | bash
This script automatically detects your operating system and architecture, downloads the correct pre-built binary, and installs it to /usr/local/bin/.
Note
You may be prompted for your sudo password during installation to move the binary to the system path.
Custom Installation
For more control over the installation process, you can pass arguments to the installation script.
Install to a custom directory, useful for non-root users or specific environment configurations (e.g., ~/.local/bin):
curl -fsSL https://raw.githubusercontent.com/joule-profiler/joule-profiler/main/install.sh | bash -s -- --dir ~/.local/bin
Install a specific version:
If you need to install a specific version depending on the features you need:
curl -fsSL https://raw.githubusercontent.com/joule-profiler/joule-profiler/main/install.sh | bash -s -- --version v0.1.0
List available versions:
You can see the list of available versions with the installer:
curl -fsSL https://raw.githubusercontent.com/joule-profiler/joule-profiler/main/install.sh | bash -s -- --list
Non-interactive Mode, for use in automated scripts or CI pipelines:
curl -fsSL https://raw.githubusercontent.com/joule-profiler/joule-profiler/main/install.sh | bash -s -- --yes
Build from Source
You can build the profiler from the sources by cloning the repository. It can be useful if you want to access the latest features not yet released, or if you intend to customize the source code.
# Clone the repository
git clone https://github.com/joule-profiler/joule-profiler.git
cd joule-profiler

# Build and install system-wide
cargo build --release
sudo cp target/release/joule-profiler /usr/local/bin/

# Verify installation
sudo joule-profiler --version
Tip
System-wide installation (
/usr/local/bin/) is recommended as the tool requiressudoto access RAPL counters.
Uninstall
To remove Joule Profiler from your system, you can use the automated uninstaller or remove the binary manually.
Using the uninstaller:
curl -fsSL https://raw.githubusercontent.com/joule-profiler/joule-profiler/main/uninstall.sh | bash
Manually: If you installed the binary to the default location (/usr/local/bin/), you can simply delete it:
sudo rm /usr/local/bin/joule-profiler
Measurements
Overview
Joule Profiler minimizes the measurements overhead by performances only the required operations during program execution. Heavy computations like string formatting or allocation, data aggregation or transformation, heavy memory allocations and syscalls are deferred after the end of the profiling. During the program’ execution, it only reads sources sensors and store raw values in memory
Measurement Process
Initialization
To ensure accurate measurements from the first instruction:
- The program is spawned as a child process
- Immediately paused using
SIGSTOPbefore execution begins - The process ID (PID) is shared with all metric sources via atomic storage and operations
- Sources attach their instrumentation (e.g., perf_event counters scoped to the PID)
- The program is resumed with
SIGCONT
This allows pid filtering for sources implementing it, while minimizing the introduced overhead by stopping the program during the initialization of sources requiring per-process measurement.
Measurements
Each metric source runs in its own asynchronous task. When a measurement is triggered, every source reads their counters in parallel and stores raw values separately without data transformation. This concurrent approach allows to make the measurement of all sources at the same time and ensures precise timing control.
Measurements occur at specific points, the first triggered measurement is the initial baseline before resuming the program, then measurements are made for each phase transitions detected via regex pattern in stdout. The Final measurement is made after the completion of the program.
Post-Measurements Processing
We perform expensive operations only after the program completion. We convert raw sources values into structured metric objects and aggregate them across phases. These calculation do not have any impact on the results because the measurements are already made and the profiled program has already exited.
Phases
Overview
Phase-based profiling is the key feature that distinguishes Joule Profiler from other energy profilers. It enables energy measurement of specific sections of your program, allowing you to identify which parts contribute most to energy consumption.
Why Use Phases?
Identify Energy Hotspots
Instead of measuring total program energy, phases let you pinpoint expensive sections:
print("__INIT__", flush=True)
loading()

print("__WORK__", flush=True)
process()

print("__CLEANUP__", flush=True)
Each phase appears separately in the results, showing its individual energy consumption.
Exclude Initialization
Interpreted languages (Python, JavaScript, Ruby) have significant startup overhead that dominates short programs:
# Python interpreter initialization can be 50-100ms
# Your actual work might be only 10ms
sudo joule-profiler profile -- python my_script.py
# Result: 90% of energy is interpreter startup, not what you want to measure
If you want to exclude this initialization phase, then using phases might be a good answer:
# my_script.py
import heavy_libraries
model = load()  # Initialization overhead

print("__START__", flush=True)  # Mark the beginning of actual work
process()    # This is what you want to measure
print("__END__", flush=True)
sudo joule-profiler profile --token-pattern "__START__|__END__" -- python my_script.py
Now you measure the __START__ to __END__ phase, excluding interpreter startup and library loading.
Implementation Notes
Phases are detected by monitoring the program’s stdout for tokens matching a regular expression. The profiler spawns the program and capture the standard output. Then, it scans each line and triggers measurements when tokens matching the configured regex pattern are detected. Finally, it associates metrics to each phase.
Future versions may support lower-overhead mechanisms like inter-process communication with language-specific wrappers to minimize the overhead introduced by I/O operations.
Overview
Sources Overview
Joule Profiler is designed to be simple, portable, and focused on monitoring the components responsible for the majority of energy consumption, such as the CPU, GPU, and SoC. While it does not aim to support every possible energy source on every device, the profiler can be extended by implementing custom sources for specific devices or components.
Supported Architectures
- CPU: The only target is Intel and AMD x86 architecture at the moment.
- GPU: Current focus is on Nvidia GPUs.
- OS: Only Linux-based systems are officially supported at the moment.
Available Sources
-
Intel RAPL: Measures CPU energy consumption.
- Available on most Intel CPUs since Sandy Bridge architecture in 2011, and most AMD CPUs since Zen microarchitecture in 2017.
- Implemented using either perf_event or Powercap on Linux systems.
- For details, see RAPL.
-
Nvidia GPUs (NVML): Provides energy and performance metrics for Nvidia GPUs, see NVML.
-
perf_event: Measures various performance counters like hardware or software on Linux systems, see perf_event.
Extending Joule Profiler
Users can implement new metric sources allowing the monitoring of additional devices or components beyond the default set. For guidance, see Adding a New Source.
RAPL
Overview
RAPL (Running Average Power Limit) is an Intel processor feature that allows real-time energy consumption measurements of CPU and memory subsystem.
This technology has been available on most Intel processors since Sandy Bridge generation (2011), and is also available on some AMD processors since Zen architecture (2017).
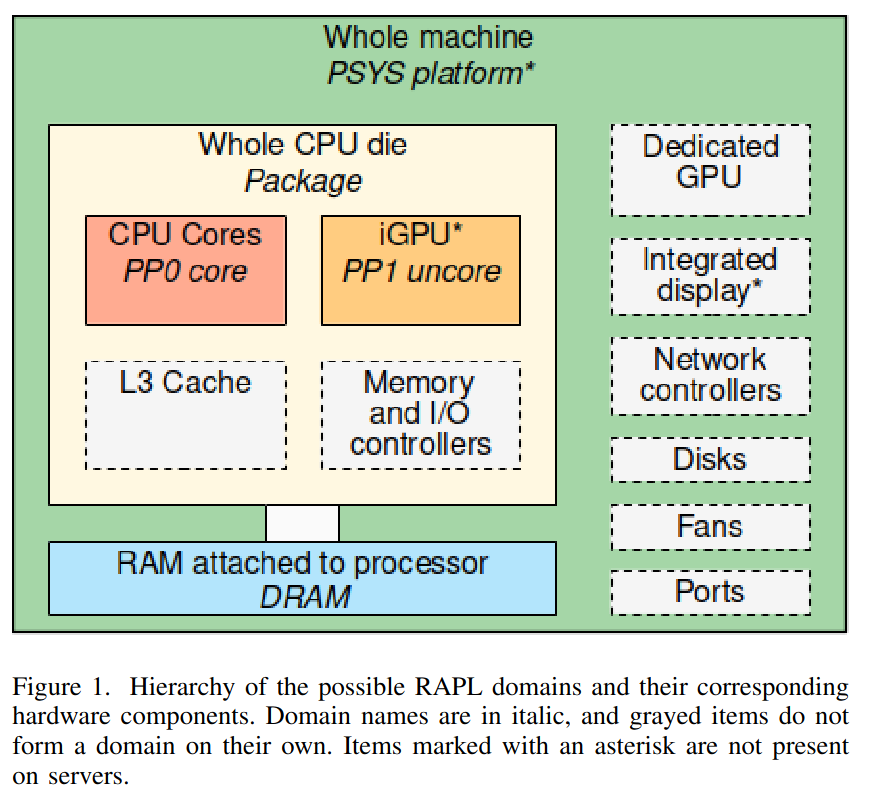
RAPL provides energy measurements at different scales (e.g.,CPU core, integrated GPU, package), enabling you to measure energy consumption per component and understand more precisely how each part of the system contributes to the overall power usage.
Architecture
RAPL interface exposes multiple power domains that allow measuring energy consumption of different parts of the processor and memory subsystem. Domains metrics are accessible through model-specific registers (MSRs) on the host system, enabling user to monitor power usage in real time.
Domains
| Domain | Description |
|---|---|
| Package/PKG | Entire CPU socket. This includes cores and uncore components. |
| Core/PP0 | Represents the CPU cores only. Useful for profiling per-core energy consumption. |
| Uncore/PP1 | Covers the energy consumption of the integrated GPU if available. |
| DRAM | Dynamic random access memory attached to the integrated memory controller if supported. |
| PSYS | Entire SoC energy consumption, unique (only one PSYS for the entire SoC at most, available since Skylake generation) |
Architecture of RAPL1:
Note
- Some of the domains may not appear depending on the processor architecture.
- The PSYS domain can report the same consumption as an external wattmeter 1, representing the entire computer consumption. These results, obtained on a laptop, should be interpreted with caution and could not reflect the real world.
-
G. Raffin and D. Trystram, “Dissecting the Software-Based Measurement of CPU Energy Consumption: A Comparative Analysis,” in IEEE Transactions on Parallel and Distributed Systems, vol. 36, no. 1, pp. 96-107, Jan. 2025, doi: 10.1109/TPDS.2024.3492336. ↩ ↩2
Powercap
Overview
Powercap1 is a Linux kernel framework that provides a generic and standardized interface for power capping and energy monitoring accross different hardware power domains.
Instead of accessing low-level hardware registers (e.g MSRs), Powercap safely exposes energy metrics via sysfs.
The use of powercap instead of MSRs may seem disadvantageous and cause more overhead while measuring energy consumption, but there is actually no or an insignificant overhead introduced by the use of the powercap framework. Moreover, the abstraction provided by powercap increases the maintainibility, and powercap smoothens the energy results to avoid noise.
Sysfs File Structure
The Powercap framework exports energy data through the /sys/devices/virtual/powercap or /sys/class/powercap directories. Each physical CPU socket or hardware component is represented as a control type (usually intel-rapl).
Within intel-rapl, the hierarchy is organized by zones and subzones, which correspond to the RAPL domains (Package, Core, DRAM, etc.).
The structure typically looks like this:
/sys/devices/virtual/powercap
└── intel-rapl/
    ├── intel-rapl:0/                # Package 0 (CPU Socket 0)
    │   ├── name                     # Content: "package-0"
    │   ├── energy_uj                # Cumulative energy in microjoules
    │   ├── max_energy_range_uj      # Overflow value for the counter
    │   ├── intel-rapl:0:0/          # Subzone: Core (PP0)
    │   │   ├── name                 # Content: "core"
    │   │   └── energy_uj
    │   ├── intel-rapl:0:1/          # Subzone: DRAM
    │   │   ├── name                 # Content: "dram"
    │   │   └── energy_uj
    │   └── intel-rapl:0:2/          # Subzone: Uncore (PP1)
    │       ├── name                 # Content: "uncore"
    │       └── energy_uj
    └── intel-rapl:1/                # Package 1 (CPU Socket 1, if multi-socket)
To retrieve the domains measure energy consumption, the following files are accessed:
name: The name of the corresponding domain (Package, Core, Uncore, DRAM or Psys).energy_uj: This is the core metric. It provides the current energy consumption in microjoules (µj).max_energy_range_uj: This file gives the maximum value before the counter wraps back to zero.
Overflow Handling
Because the RAPL energy counters are stored in hardware with four bytes of information, they will eventually reach their maximum value and wrap around (overflow) back to zero.
The max_energy_range_uj file to indicate this threshold. To ensure accurate measurements, especially for long-running benchmarks, the monitoring tool must implement a robust overflow detection and correction logic.
To handle these overflows, the measurement worker thread performs frequent polling of the energy_uj files. By sampling the counters at a rate significantly higher than the theoretical minimum time it takes for a counter to wrap around, we can safely detect an overflow and correct it. The polling rate must be higher than the minimal period of an overflow, otherwise, an overflow could not be always detected.
In the future, we might implement an adaptive overflow period to minimize polling and reduce the overhead it introduces, even so it is negligible under hundreds of hertz.
The period of an overflow will depend mostly on the CPU wattage, but also on the domain, the DRAM package will not overflow often, while the psys or package domains might overflow in several minutes during high power consuming workload.
Theoretically, for a processor with a consumption of 200 W and a max_energy_range_uj of 262143328850 (common domain max_energy_range_uj), the package domain which represents the entire CPU consumption will overflow in around 22 minutes with a constant consumption.
Here is a graphic of the theoretical overflow time depending on the CPU wattage:

| Power (W) | Overflow time (min,sec) |
|---|---|
| 100 | 43,41 |
| 200 | 21,50 |
| 300 | 14,33 |
| 400 | 10,55 |
| 500 | 8,44 |
| 600 | 7,16 |
| 700 | 6,14 |
| 800 | 5,27 |
| 900 | 4,51 |
| 1000 | 4,22 |
Note
These overflow times are indicative only and serve as a reference scale. Actual values vary across hardware, kernel behavior, and workloads and must not be considered fixed thresholds.
perf_event
Overview
For a detailed overview of what perf_event is and how it works, see perf_event, here we will discuss only about the measurements of RAPL domains counters.
To measure the energy consumption of the RAPL domains through perf_event, we’re using the perf_event_open_sys rust crate, which is a wrapper around the perf_event_open Linux system call, used to open perf event counters. The crate also provides bindings to associated perf_event I/O controllers to manage the opened counters.
Overflow Handling ?
Unlike powercap, perf_event handles the MSRs overflows and store counters on eight bytes. Moreover, the counters start at zero, which make them easy to compute and also completely prevent overflows, for example, on a CPU consuming at an average of 200 W, it would take 2924 years to overflow the package domain.
Thus, using perf_event, we do not need to implement polling strategies like with powercap, it is impossible for a domain counter to overflow.
Limitations
Unlike most perf_event counters, per-process energy consumption cannot be inferred for RAPL domains. This is because RAPL is not designed to expose per-process energy measurements, and perf_event does not perform aggregation of RAPL counters to estimate per-process domain-level energy consumption.
RAPL counters exposed through perf do not support event grouping, which prevents managing all domains via a single ioctl and necessitates independent management of each domain.
Backend Comparison
Should you use Powercap of perf_event ?
Powercap is a framework for controlling and limiting power while perf_event is a tool for measuring performance counters.
Thus, their design differs from each other, perf_event uses kernel mechanisms to minimize user–kernel transitions during data collection, reducing overhead for frequent measurements, while Powercap relies on a sysfs interface, where each read or write triggers a kernel entry, making it more suitable for infrequent operations or control tasks.
While they both use the same underlying technology (e.g., MSRs for Intel RAPL), they operate at different abstraction layers. perf_event provides a measurement-oriented interface optimized for profiling, whereas Powercap provides a control-oriented interface suitable for setting power limits or enforcing budgets.
| Scenario | Recommended Interface | Reason |
|---|---|---|
| High-frequency, fine-grained energy measurement | perf_event | Minimal overhead introduced and less transition from user to kernel space |
| Moderate to low-frequency | perf_event or Powercap | Syscall overhead is acceptable, perf_event requires more configuration (perf_event_paranoid), while powercap is easy to use |
Summary: You should always prefer to use perf_event if it is configured on your system, but powercap is turnkey and easy to use.
Why not use MSRs ?
We can access MSRs through the filesystem at /dev/cpu/{core}/msr, therefore, in principle we could read RAPL counters directly from the registers to minimize overhead.
In practice, direct MSR access from userspace does not necessarily provide better performance1 than the powercap interface, which is already optimized for safe and efficient energy accounting. Reading MSRs from userspace requires a system call for each access, and repeated reads across multiple domains increase overhead. As a result, user-space MSR reads are generally slower than accessing the same counters through kernel-level drivers such as powercap, which can read and process the registers efficiently without repeated user to kernel context switches. In addition, raw MSR reads can exhibit greater variability at short time scales due to the absence of kernel-managed aggregation and coordinated sampling, whereas powercap provides more consistent and reproducible energy measurements by performing aggregation entirely within the kernel.
Moreover, using MSRs directly requires explicit management of overflow, unit scaling, and platform-specific behavior, reduces portability, and can introduce safety and consistency issues that higher-level kernel interfaces such as Linux’s powercap framework handle automatically.
-
G. Raffin and D. Trystram, “Dissecting the Software-Based Measurement of CPU Energy Consumption: A Comparative Analysis,” in IEEE Transactions on Parallel and Distributed Systems, vol. 36, no. 1, pp. 96-107, Jan. 2025, doi: 10.1109/TPDS.2024.3492336. ↩
Measurement Accuracy
Joule Profiler relies on the MSR (Model-Specific Register) counters provided by the RAPL interface to deliver CPU energy metrics at different scopes.
Measurement Unit
RAPL energy counters report measurements in microjoules (). This high-precision unit ( joules) theoretically allows for extremely detailed energy accounting. However, it is important to note that while the data format is precise, the effective accuracy is bound by the hardware’s update frequency and the specific implementation of the voltage regulators on the motherboard.
Limitations
While RAPL is a powerful tool, it has inherent constraints that users should be aware of when interpreting results.
Lack of Per-Process Attribution
Although the RAPL interface provides multiple domains for fine-grained energy profiling, measurements are performed at the hardware level. Thus, it does not natively support per-process energy attribution. This makes it difficult to accurately assess the isolated energy consumption of a single process.
Hardware Variability
The availability of specific power domains is strictly hardware-dependent. Domains such as DRAM or PSYS (Platform System) might not be available depending on the specific CPU generation or platform configuration. Energy measurements can also be noisier on some systems, such as laptops, due to more aggressive power management and variable clock speeds.
Temporal Resolution
Very short or highly variable workloads may not be measured accurately. The hardware counters update at a fixed rate, so rapid changes in energy consumption can be missed between samples. For this reason, longer-running workloads generally produce more reliable results than microbenchmarks.
NVIDIA Management Library (NVML)
Overview
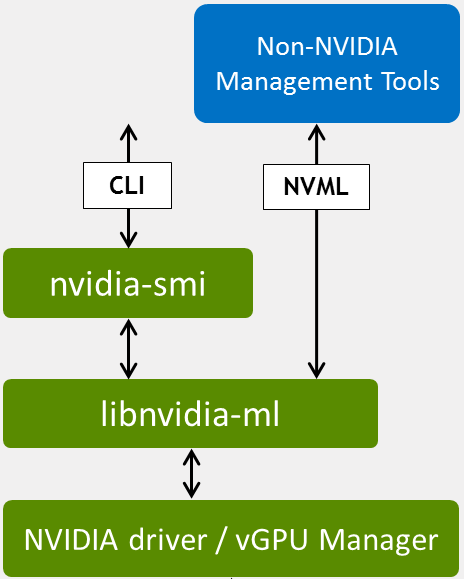
The NVIDIA Management Library (NVML) is a C-based programmatic interface for monitoring and managing NVIDIA GPUs. It is the underlying library used by the standard nvidia-smi1 tool and provides direct access to the GPU driver.
Joule Profiler interfaces with NVML using the nvml-wrapper2 Rust crate to retrieve reliable hardware energy counters.
Architecture
NVML is distributed as libnvidia-ml.so on Linux and communicates directly with the NVIDIA GPU driver to query device state.
Setup & Requirements
To use the NVML source in Joule Profiler, your system must meet specific hardware and software requirements.
Driver Requirements
Joule Profiler accesses NVML via the shared library libnvidia-ml.so (usually in /usr/lib/ or /usr/lib64/ on Linux) installed alongside the NVIDIA drivers. You do not need to install the CUDA toolkit manually, but the base GPU drivers are required.
Note
These libraries are installed automatically with standard NVIDIA Display Drivers.
Hardware Support
Energy consumption metrics are available on NVIDIA GPUs based on the Volta architecture (e.g., Tesla V100, Titan V) and newer. This includes all modern consumer architectures starting from Turing (RTX 20 series). Older architectures (Pascal, Maxwell, Kepler) may report other metrics but do not expose the energy counters required by this profiler.
Verification
Before running Joule Profiler, you can verify that your drivers are correctly installed and that your GPU supports management queries using the standard nvidia-smi tool.
Run the following command in your terminal:
nvidia-smi -q -d POWER
The output should look similar to the following:
==============NVSMI LOG==============

Timestamp                                 : Sat Feb  7 11:17:58 2026
Driver Version                            : 550.163.01
CUDA Version                              : 12.4

Attached GPUs                             : 1
GPU 00000000:01:00.0
    GPU Power Readings
        Average Power Draw                : N/A
        Instantaneous Power Draw          : 31.64 W
        Current Power Limit               : 140.00 W
        ...
Warning
If your output does not show “Power Draw” or “Energy Consumption,” your hardware may not support the necessary features for this profiler.
Metrics
Joule Profiler utilizes NVML to retrieve energy consumption metrics, focusing on the power usage of the GPU components.
Collected Metrics
| Metric | Unit | Description | Scope |
|---|---|---|---|
| Energy Consumption | Millijoules (mJ) | Total energy consumed by the GPU since the driver was loaded or the counter was reset. | Per GPU Device |
While NVML is capable of reporting various other telemetry data (such as fan speeds, temperature, and clock rates), Joule Profiler focuses specifically on the energy counters to compute the power usage of your application phases.
Precision and Overflow
The energy counters provided by NVML are 64-bit unsigned integers representing energy in millijoules (mJ).
Overflow Analysis
This unit allows energy to be measured over extremely long periods without realistic concern for integer overflow. For example, considering a GPU consuming approximately 300 W continuously:
Consequently, overflow of the NVML energy counter is generally ignored in our design as the time required to trigger it exceeds any practical profiling duration. However, in the unlikely event that an overflow does occur, we utilize wrapping subtraction to ensure measurements remain consistent without panicking.
perf_event
Overview
perf_event is the Linux kernel’s performance monitoring API that provides access to hardware, software and other like PMU supported counters.
It allows fine-grained measurement of low-level events such as CPU cycles, instructions retired, cache misses, branch mispredictions, context switches, PMU supported counters and more. These events can be used to analyze performance bottlenecks, execution efficiency, and in combination with hardware counters it can be used to help estimating energy and power-related insights.
The perf_event subsystem has been part of the Linux kernel since version 2.6.31 and is supported on most modern architectures, including x86, ARM, and RISC-V.
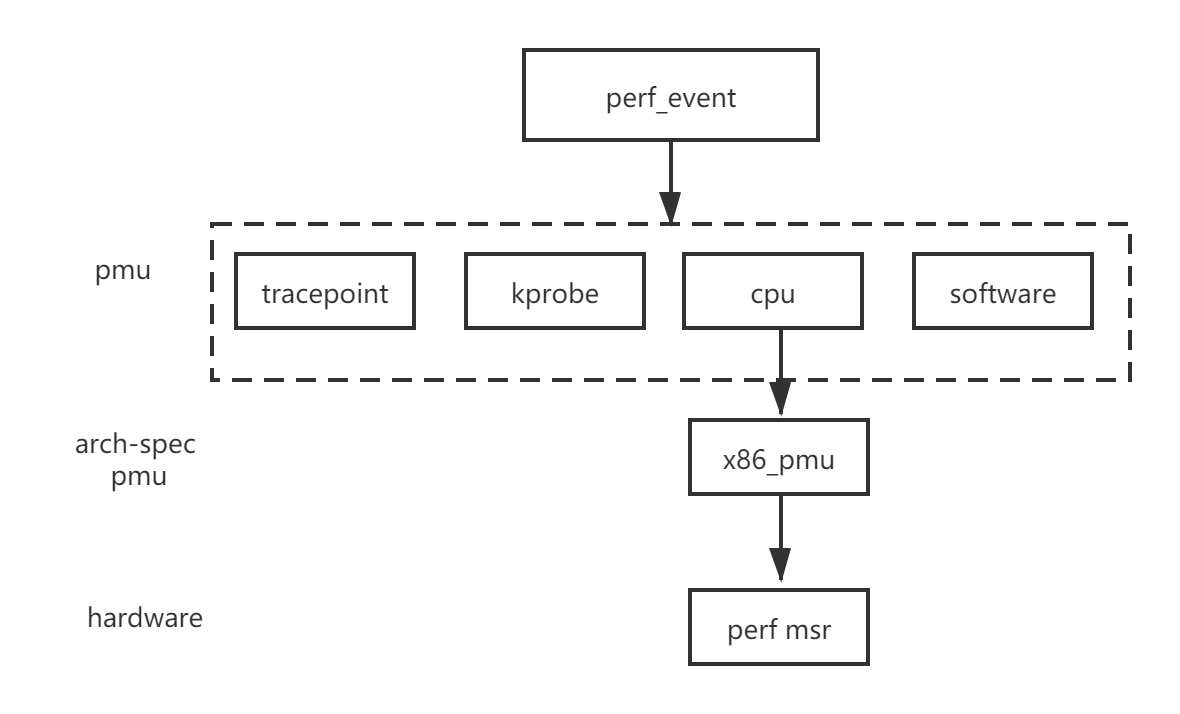
Architecture
The perf_event interface exposes a unified abstraction over multiple types of performance events. Events are collected by the kernel and accessed through the perf_event_open system call, which enables user-space tools to configure, start, stop, and read counters.
Events can be attached to a specific context like process, CPU core or control group, but Joule Profiler only supports per-process counters at the moment.
Event Types
perf_event supports several categories of events:
| Event Type | Description |
|---|---|
| Hardware | CPU-provided events such as cycles, instructions, cache references, and cache misses. |
| Software | Kernel-provided counters such as context switches, page faults, and CPU migrations. |
| Hardware Cache | Cache-specific events broken down by cache level, operation, and result. |
| Tracepoint | Kernel tracepoints for observing system-level behavior. |
| Raw | Architecture-specific events accessed via raw event codes. |
| PMU-specific | Events exposed by hardware-specific Performance Monitoring Unit (PMU) like RAPL counters |
perf_event event types:
Note
- The availability and accuracy of events depend on the underlying hardware PMU and kernel configuration.
- Access to certain events may require elevated privileges or relaxed kernel settings, see perf_event_paranoid.
How It Works
Kernel Counter Management
The Linux kernel manages performance counters through the perf_event subsystem. When a perf_event counter is opened, the Linux kernel allocates a counter and periodically reads the hardware Performance Monitoring Unit (PMU) registers. It maintains counter values across context switches and timer interrupts.
Counter Multiplexing
Hardware PMUs have limited counters (typically 4-8 per CPU core). When more events are requested than available counters, the kernel multiplexes them. The kernel multiplexing organize counters into groups and rotates them around every millisecond, meaning that only one group of counters can run at a time. To solve this issue, perf_event keeps track of when the timer is enabled and when it’s actually running, allowing to scale them when they are multiplexed. However, counter scaling can introduce an error because it is an estimation of the global value out of different local ones, thus weakening the detection of small variabilities.
Memory-Mapped Access
The standard read() system call requires a context switch (100-300ns overhead). The kernel offers an mmap interface for lower overhead. It maps a kernel memory page into user space, thus allowing to read counter state directly from this share memory via CPU instructions (e.g., rdpmc) without any system call taking 10 to 50 nanoseconds.
This is useful for high-frequency monitoring where system call overhead would be significant.
For now, Joule Profiler is using the read syscall, but we may implement an mmap version to reduce the overhead of the syscalls.
References
perf_event_paranoid
Overview
perf_event_paranoid is a kernel tunable that controls access permissions to performance monitoring events. It determines what level of privilege is required to use various perf_event features.
This setting is crucial for security, as unrestricted access to performance counters can potentially leak sensitive information about system behavior and other processes.
Permission Levels
The /proc/sys/kernel/perf_event_paranoid file accepts integer values that define access restrictions:
| Level | Description | Access restrictions |
|---|---|---|
| -1 | No restrictions | All users can access all events, including kernel profiling and CPU-specific events. Not recommended. |
| 0 | Relaxed (default on some systems) | Unprivileged users can perform per-process profiling but cannot profile kernel space or other users’ processes. |
| 1 | Moderate | Unprivileged users can only access CPU events (cycles, instructions). No access to kernel profiling or tracepoints. |
| 2 | Restricted (common default) | Unprivileged users cannot use perf_event_open at all. Only CAP_PERFMON or CAP_SYS_ADMIN capabilities allowed. |
| 3 | Fully restricted | Denies all access to perf events, even for privileged processes (rarely used). |
| 4 | Maximum restriction | Complete lockdown of perf subsystem. |
Note
The default value varies by distribution but is set to 2 by default on most distro.
Checking Current Setting
# View current paranoid level
cat /proc/sys/kernel/perf_event_paranoid
Configuring perf_event_paranoid
# Set to level 1 (moderate restrictions)
sudo sysctl kernel.perf_event_paranoid=1

# Or directly write to proc
echo 1 | sudo tee /proc/sys/kernel/perf_event_paranoid
Security Implications
Performance counters can expose sensitive information about other processes. An attacker could do a side-channel attack and measure execution time to infer cryptographic keys or other secrets, he could also observe cache behavior to extract data.
Safe Practices
-
Use capabilities instead of paranoid level:
# Grant CAP_PERFMON to specific binaries sudo setcap cap_perfmon=ep /path/to/joule-profiler -
Limit access to specific users:
# Add user to perf_users group (if your distro supports it) sudo usermod -aG perf_users $USER -
Run with sudo when needed:
sudo perf stat -e cycles ./my_program
Troubleshooting
“Permission denied” errors
Error: perf_event_paranoid level is 1, try setting it to 0 or launch Joule Profiler with root rights
Solution: Either lower perf_event_paranoid level, grant Joule Profiler CAP_PERFMON capability or launch it with root privileges (sudo).
Note
To access RAPL counters using perf_event, you need to set perf_event_paranoid level to 0, or launch the profiler with root privileges.
References
Accuracy and Limitations
Measurement Scopes
Events can be measured at different execution scopes but Joule Profiler only support per-process counters.
| Scope | Description |
|---|---|
| Per-thread | Counts events generated by a single thread. |
| Per-process | Aggregates events across all threads of a process. |
| Per-CPU | Counts events occurring on a specific CPU core. |
| System-wide | Aggregates events across all CPUs. |
Important
Some events like RAPL power counters are always system-wide and cannot be scoped to individual processes or threads.
Multiplexing and Accuracy
Hardware has limited performance counters (typically 4-8 per CPU core). When measuring more events than available counters, the kernel multiplexes them by rotating access, which can introduce overhead.
Multiplexed counters produce scaled estimates: scaled_value = value * (time_enabled / time_running), introducing measurement error. The more the ratio is close to one, the more the counters are accurate.
Examples
This section provides practical examples to help you get started with Joule Profiler.
Examples in Documentation
Throughout this documentation, you’ll find examples showing common use cases and best practices.
Examples in Repository
The Joule Profiler repository contains complete working examples:
- Example Programs (
examples/programs/): Sample programs in various languages. - Example Outputs (
examples/data/): Real profiling results in all supported formats (terminal, JSON, CSV).
Clone the repository and explore the examples/ directory to see real-world usage and expected output formats, else see the differents examples:
Minimal Example
This guide shows the minimal example to use Joule Profiler.
Minimal Measurement
Measure any program’s energy consumption:
# Measure a simple command
sudo joule-profiler profile -- sleep 1

# Measure a Python script
sudo joule-profiler profile -- python my_script.py

# Measure a compiled program with arguments
sudo joule-profiler profile -- ./my-program arg1 arg2
Basic Phase Detection
Add phase markers to your program:
Python example:
# my_script.py
import time

print("__START__", flush=True)
time.sleep(1)
print("__END__", flush=True)
The profiler will measure energy separately for the __START__ to __END__ phase.
Phase Detection
This guide shows how to add phase markers to your programs for energy profiling.
Basic Concept
Print tokens to stdout and detect different sections of your code. The profiler detects these tokens and measures each section separately.
Add Phase Markers
Here are several examples in different languages:
Python:
print("__INIT__", flush=True)
load()

print("__PROCESSING__", flush=True)
process()
C:
printf("__INIT__\n");
fflush(stdout);
load();

printf("__PROCESSING__\n");
fflush(stdout);
process();
Rust:
#![allow(unused)]
fn main() {
println!("__INIT__");
std::io::stdout().flush().unwrap();
load();

println!("__PROCESSING__");
std::io::stdout().flush().unwrap();
process();
}
Important
Always flush stdout immediately after printing tokens, buffered output may not be detected in time.
Choose a Token Pattern
Create a regex pattern that matches your tokens:
# Simple pattern matching __WORD__
--token-pattern "__[A-Z_]+__"

# Custom pattern matching [WORD]
--token-pattern "\[A-Z_]+\]"

# Specific tokens only
--token-pattern "INIT|WORK|END"
Common patterns:
__[A-Z_]+__- Matches__INIT__,__WORK__,__END__<<<.*>>>- Matches<<<phase1>>>,<<<phase2>>>\[PHASE-[0-9]+\]- Matches[PHASE-1],[PHASE-2]
Run the Profiler
sudo joule-profiler profile --token-pattern "__[A-Z_]+__" -- python my_script.py
Joule Profiler will profile the program by detecting tokens matching the configured pattern in the standard output. It will make a measurement between each token to report energy and various metrics across phases.
Complete Example
script.py:
import time

print("__LOAD__", flush=True)
data = [i for i in range(1000000)]
time.sleep(0.5)

print("__COMPUTE__", flush=True)
result = sum(data)
time.sleep(0.5)

print("__DONE__", flush=True)
Command:
sudo joule-profiler profile --token-pattern "__[A-Z_]+__" -- python script.py
Output:
Phase 0: __LOAD__ → __COMPUTE__
  Duration: 502 ms
  package-0: 1.2 J

Phase 1: __COMPUTE__ → __DONE__
  Duration: 501 ms
  package-0: 1.5 J
If you encounter some issues with phases, see troubleshooting.
Sensors Listing Example
This example shows how to list all available sensors using Joule Profiler.
Minimal Example
./target/debug/joule-profiler list-sensors
Note
You should be able to list sensors without root privileges.
And it shows:
╔════════════════════════════════════════════════╗
║  Available Sensors                             ║
╚════════════════════════════════════════════════╝

┌────────────────────────────────────────────────┐
│ RAPL (perf_event)                              │
└────────────────────────────────────────────────┘
  Name                 | Unit
 ────────────────────────────────────────────────
  PACKAGE-0            | µJ
  CORE-0               | µJ
  UNCORE-0             | µJ
  PSYS                 | µJ
With GPU support
If you want to list also your GPU devices, use the --gpu CLI flag:
./target/debug/joule-profiler --gpu list-sensors
╔════════════════════════════════════════════════╗
║  Available Sensors                             ║
╚════════════════════════════════════════════════╝

┌────────────────────────────────────────────────┐
│ NVML                                           │
└────────────────────────────────────────────────┘
  Name                 | Unit
 ────────────────────────────────────────────────
  GPU-0                | mJ

┌────────────────────────────────────────────────┐
│ RAPL (perf_event)                              │
└────────────────────────────────────────────────┘
  Name                 | Unit
 ────────────────────────────────────────────────
  PACKAGE-0            | µJ
  CORE-0               | µJ
  UNCORE-0             | µJ
  PSYS                 | µJ
With perf_event support
If you want to list also your GPU devices, use the --perf CLI flag:
./target/debug/joule-profiler --perf list-sensors
╔════════════════════════════════════════════════╗
║  Available Sensors                             ║
╚════════════════════════════════════════════════╝

┌────────────────────────────────────────────────┐
│ RAPL (perf_event)                              │
└────────────────────────────────────────────────┘
  Name                 | Unit
 ────────────────────────────────────────────────
  PACKAGE-0            | µJ
  CORE-0               | µJ
  UNCORE-0             | µJ
  PSYS                 | µJ

┌────────────────────────────────────────────────┐
│ perf_event                                     │
└────────────────────────────────────────────────┘
  Name                 | Unit
 ────────────────────────────────────────────────
  CPU_CYCLES           | count
  INSTRUCTIONS         | count
  CACHE_MISSES         | count
  BRANCH_MISSES        | count
Output Formats
Joule Profiler supports several output formats to accommodate different usage scenarios and workflows. The terminal format is the default and is intended for quick inspection and human-readable feedback. It displays structured results directly in the console, including the command executed, phase durations, and per-source metrics. This format is ideal when you want to observe the results interactively or debug a profiling run. For details, see Terminal Output Format. For now, the output formats are only available using the CLI.
For automated processing, further analysis, or integration with pipelines, Joule Profiler can export results in JSON format using the --json CLI flag. JSON provides a structured representation of the profiling session, including command information, phase metadata, metric values, and iteration details when applicable. This format is well-suited for programmatic consumption, logging, or exporting to other tools. See JSON Output Format for more information.
When metrics need to be analyzed in spreadsheet software, notebooks or imported into other tabular tools, the profiler can generate a CSV output via the --csv flag. Each metric is represented as a row with associated phase, iteration, and source information. This flattened format facilitates aggregation, plotting, or other analyses where a row-per-metric structure is advantageous. More details can be found in CSV Output Format.
Overall, the choice of output format depends on your workflow: the terminal is optimized for immediate human inspection, JSON is designed for programmatic workflows, and CSV is suited for tabular analyses and external data processing.
In the future, the output formats might be moved from the CLI module to another module, enabling users to use them outside of the CLI when they’re using the library.
For detailed example outputs, check the different output formats examples:
Terminal Output Format
When using Joule Profiler in the terminal (default output), the results are displayed in a human-readable, structured format.
This section explains the different sections and the information shown.
Header
The header includes theses fields by default:
- Phase name - Interval covered by the phase (can include custom tokens if the program outputs them).
- Duration - Time spent in this phase.
- Start / End token - Detected markers in the program output.
Phases mark sections of the program you want to measure. By default, the profiler includes a single phase: START -> END.
╔════════════════════════════════════════════════╗
║  Phase: START -> END                           ║
╚════════════════════════════════════════════════╝
  Duration            :       1878 ms
  Start token         :      START
  End token           :        END
After the phase information, metrics from each source are displayed:
┌────────────────────────────────────────────────┐
│ RAPL (perf_event)                              │
└────────────────────────────────────────────────┘
  CORE-0              :   46068364 µJ
  DRAM-0              :    1287350 µJ
  PACKAGE-0           :   66901990 µJ
Metrics are grouped by metric source (e.g., powercap, nvidia-nvml, perf, etc.)
Note
All metrics are reported for each phase.
Profile Example
The command:
joule-profiler profile -- python3 nbody.py 500000
Shows:
╔════════════════════════════════════════════════╗
║  Command                                       ║
╚════════════════════════════════════════════════╝
  python3 nbody.py 500000

╔════════════════════════════════════════════════╗
║  Phase: START -> END                           ║
╚════════════════════════════════════════════════╝
  Duration            :       1878 ms
  Start token         :      START
  End token           :        END

┌────────────────────────────────────────────────┐
│ RAPL (perf_event)                              │
└────────────────────────────────────────────────┘
  CORE-0              :   46068364 µJ
  DRAM-0              :    1287350 µJ
  PACKAGE-0           :   66901990 µJ
Listing Sensors
Here is an example of sensors listing in terminal format:
joule-profiler list-sensors
Outputs:
╔════════════════════════════════════════════════╗
║  Available Sensors                             ║
╚════════════════════════════════════════════════╝
  Name                 | Unit  | Source
 ────────────────────────────────────────────────
  PSYS-1               | µJ    | RAPL (perf_event)
  PACKAGE-0            | µJ    | RAPL (perf_event)
  CORE-0               | µJ    | RAPL (perf_event)
  UNCORE-0             | µJ    | RAPL (perf_event)
JSON Output Format
When using Joule Profiler with --json, results are exported as structured JSON.
This format is suitable for programmatic processing, analysis, or exporting to other tools.
Fields
A JSON output of Joule Profiler contains these fields:
| Field | Description |
|---|---|
command | Program and arguments executed |
token_pattern | Regex used to detect phase tokens |
exit_code | Return code of the program |
phases | Array of measured phases |
index | Phase index |
start_token / end_token | Phase markers |
timestamp | Start timestamp |
duration_ms | Phase duration in milliseconds |
metrics | List of metrics collected by sources |
metrics[].name | Sensor name |
metrics[].value | Measured value |
metrics[].unit | Unit of measurement (e.g., µJ) |
metrics[].source | Metric source name (e.g., RAPL, NVML) |
Profile Example
The command:
joule-profiler --json profile -- python3 nbody.py 500000
Displays:
{
  "command": "python3 nbody.py 500000",
  "token_pattern": "__[A-Z0-9_]+__",
  "exit_code": 0,
  "phases": [
    {
      "index": 0,
      "start_token": "START",
      "end_token": "END",
      "timestamp": 1769987285805,
      "duration_ms": 1895,
      "metrics": [
        {
          "name": "CORE-0",
          "value": 45010261,
          "unit": "µJ",
          "source": "powercap"
        },
        {
          "name": "DRAM-0",
          "value": 1302425,
          "unit": "µJ",
          "source": "powercap"
        },
        {
          "name": "PACKAGE-0",
          "value": 51537160,
          "unit": "µJ",
          "source": "powercap"
        }
      ]
    }
  ]
}
Listing Sensors
Here is an example of sensors listing in json format:
joule-profiler --json list-sensors
[
  {
    "name": "PSYS-1",
    "unit": "µJ",
    "source": "powercap"
  },
  {
    "name": "PACKAGE-0",
    "unit": "µJ",
    "source": "powercap"
  },
  {
    "name": "CORE-0",
    "unit": "µJ",
    "source": "powercap"
  },
  {
    "name": "UNCORE-0",
    "unit": "µJ",
    "source": "powercap"
  }
]
CSV Output Format
Joule Profiler can also export results as CSV using the --csv CLI flag.
This format is suitable for spreadsheets, scripting, or import into analysis tools.
CSV Header
The CSV file contains the following columns:
| Column | Description |
|---|---|
phase_id | Phase index |
phase_name | Phase name, e.g., "START -> END" |
phase_duration_ms | Duration of the phase in milliseconds |
metric_name | Name of the metric (sensor) |
metric_value | Measured value |
metric_unit | Unit of the measurement (e.g., µJ) |
metric_source | Source of the metric (e.g., powercap) |
start_token | Phase start token |
end_token | Phase end token |
start_line | Line number in program output where phase started (optional) |
end_line | Line number in program output where phase ended (optional) |
timestamp | Start timestamp of the phase (ms since epoch) |
command | Command executed |
exit_code | Program exit code |
token_pattern | Regex used to detect phase tokens |
Profile Example
phase_id;phase_name;phase_duration_ms;metric_name;metric_value;metric_unit;metric_source;start_token;end_token;start_line;end_line;timestamp;command;exit_code;token_pattern
0;"START -> END";1859;CORE-0;45935552;µJ;powercap;START;END;;;1769987854341;"python3 nbody.py 500000";0;"__[A-Z0-9_]+__"
0;"START -> END";1859;DRAM-0;1283811;µJ;powercap;START;END;;;1769987854341;"python3 nbody.py 500000";0;"__[A-Z0-9_]+__"
0;"START -> END";1859;PACKAGE-0;66560987;µJ;powercap;START;END;;;1769987854341;"python3 nbody.py 500000";0;"__[A-Z0-9_]+__"
Which gives:
| phase_id | phase_name | phase_duration_ms | metric_name | metric_value | metric_unit | metric_source | start_token | end_token | start_line | end_line | timestamp | command | exit_code | token_pattern |
|---|---|---|---|---|---|---|---|---|---|---|---|---|---|---|
| 0 | START -> END | 1859 | CORE-0 | 45935552 | µJ | powercap | START | END | 1769987854341 | python3 nbody.py 500000 | 0 | [A-Z0-9]+_ | ||
| 0 | START -> END | 1859 | DRAM-0 | 1283811 | µJ | powercap | START | END | 1769987854341 | python3 nbody.py 500000 | 0 | [A-Z0-9]+_ | ||
| 0 | START -> END | 1859 | PACKAGE-0 | 66560987 | µJ | powercap | START | END | 1769987854341 | python3 nbody.py 500000 | 0 | [A-Z0-9]+_ |
Listing Sensors
Here is an example of sensors listing in CSV format:
sensor;unit;source
PSYS-1;µJ;powercap
PACKAGE-0;µJ;powercap
CORE-0;µJ;powercap
UNCORE-0;µJ;powercap
which gives the following table:
| sensor | unit | source |
|---|---|---|
| PSYS-1 | µJ | powercap |
| PACKAGE-0 | µJ | powercap |
| CORE-0 | µJ | powercap |
| UNCORE-0 | µJ | powercap |
Note
- CSV is semicolon-separated for compatibility with most spreadsheet software.
- Each row represents one metric for a single phase.
- Multiple iterations are flattened in sequence, making it easy to filter by
iteration_id.- Programmatic tools can aggregate phases, iterations, and sources easily using the CSV columns.
Source Implementation
Implementing a new metric source in Joule Profiler is straightforward. By implementing the MetricReader trait, you only need to define the core measurement logic (measure, retrieve, get_sensors, to_metrics, get_name) and optionally override init or join if your source requires setup or polling logic. This design makes it easy to add new sources without boilerplate.
use joule_profiler_core::{
    sensor::{Sensor, Sensors},
    source::{MetricReader, MetricSourceError},
    types::{Metric, Metrics},
    unit::{MetricUnit, Unit, UnitPrefix},
};

const MY_SOURCE_UNIT: MetricUnit = MetricUnit {
    prefix: UnitPrefix::None,
    unit: Unit::Count,
};

#[derive(Default)]
struct MySource {
    count: u64,
}

impl MySource {
    pub fn new() -> Self {
        Self::default()
    }
}

impl MetricReader for MySource {
    type Type = u64;

    type Error = MetricSourceError;

    async fn measure(&mut self) -> Result<(), Self::Error> {
        self.count += 1;
        Ok(())
    }

    async fn retrieve(&mut self) -> Result<Self::Type, Self::Error> {
        let count = self.count;
        self.count = 0;
        Ok(count)
    }

    fn get_sensors(&self) -> Result<Sensors, Self::Error> {
        let sensor = Sensor::new("value", MY_SOURCE_UNIT, "my_source")
        Ok(vec![sensor])
    }

    fn to_metrics(&self, count: u64) -> Result<Metrics, Self::Error> {
        let metric = Metric::new("value", count, MY_SOURCE_UNIT, "my_source");
        Ok(vec![metric])
    }

    fn get_name() -> &'static str {
        "my_source"
    }
}
Overview
Joule Profiler is designed to minimize measurement overhead while maintaining high performance, modularity, extensibility, and a strong separation of concerns.
This architecture enables an efficient asynchronous scheduling and minimizes the overhead introduced into the results. It makes easy the integration of new metric sources and allows user to define their own metric sources extensions without modifying the core.
flowchart LR
%%{init: {'flowchart': {'nodeSpacing': 20, 'rankSpacing': 30}}}%%

subgraph Sources
    RAPL
    NVML(Nvidia-Nvml)
    PERF(Perf events)
end

JouleProfiler((JouleProfiler))
Orchestrator

subgraph OUTPUTS[Output formats]
    Terminal
    JSON
    CSV
end

JouleProfiler e1@-->|Measure phases| Orchestrator
e1@{ animate: true }

JouleProfiler -->|Retrieve event| Orchestrator
Orchestrator -->|Join + retrieve results| JouleProfiler

Orchestrator e2@-->|Schedule| Sources
e2@{ animate: fast }

Orchestrator -->|Join tasks| Sources
Orchestrator e3@-->|Measure events| Sources
e3@{ animate: true }

JouleProfiler --> Terminal
JouleProfiler --> JSON
JouleProfiler --> CSV

linkStyle 0 stroke:#e67e22, stroke-width:2px
linkStyle 1 stroke:#e74c3c, stroke-width:2px
linkStyle 2 stroke:#e74c3c, stroke-width:2px
linkStyle 3 stroke:#9b59b6, stroke-width:2px
linkStyle 4 stroke:#e74c3c, stroke-width:2px
linkStyle 5 stroke:#e67e22, stroke-width:2px
linkStyle 6 stroke:#27ae60, stroke-width:2px
linkStyle 7 stroke:#27ae60, stroke-width:2px
linkStyle 8 stroke:#27ae60, stroke-width:2px
At a high level, Joule Profiler is composed of three main layers:
- Core Module - Contains all domain logic: orchestration, aggregation, and result modeling.
- CLI Module - Responsible for user input, command line arguments parsing, and startup wiring.
- Sources Workspace - Implementations of the different metric sources using the API traits.
Core Module
The Core Module is the engine of Joule Profiler, it defines the profiling model, coordinates measurements, and produces structured results.
The Core Module is responsible for the management and coordination of metric sources. It collects and aggregates results and exposes an easy to use API. It contains no user interface logic and no hardware-specific code.
The core coordinates all metric sources through a central orchestrator. It sends events to manage the metric sources and make the measurements. At the end of the profiling, it collects all the data from sources and produces a unified result set. Metric sources never interact with each other directly. All coordination flows through the core and is hidden from the sources.
This design ensure that the implementation of new metric sources, output formats, or CLI features should not require changes to the core domain logic. This ensures that existing workflows remain stable while the ecosystem grows.
During a profiling session, the core controls when measurements are made. Measurements are associated with phase boundaries and accumulated across iterations. All raw data is collected first, then processed once the measurements complete. This separation ensures consistent results and reduce the measurements overhead.
CLI Module
The CLI Module is the straightforward entry point for users.
It parses command-line input and configure the profiler to be usable quickly and easily while providing several configuration options. The CLI acts as an adapter between the user, the core domain, and the sources. Because of this separation, the CLI can evolve independently from the core logic and sources.
Here’s a summary of all the CLI arguments:
| Argument | Short | Long | Default | Description |
|---|---|---|---|---|
verbose | -v | --verbose | 0 | Verbosity level. Stack for more detail: -v, -vv, -vvv. |
rapl_path | --rapl-path | Auto-detected | Override the base path for Intel RAPL counters. Falls back to $JOULE_PROFILER_RAPL_PATH, then /sys/devices/virtual/powercap/intel-rapl. | |
sockets | -s | --sockets | All | CPU sockets to measure (e.g., 0 or 0,1). |
json | --json | false | Export results as JSON. Conflicts with --csv. | |
csv | --csv | false | Export results as semicolon-separated CSV. Conflicts with --json. | |
output_file | -o | --output-file | data<TIMESTAMP>.csv/json | Custom output file path for CSV/JSON export. |
gpu | --gpu | false | Enable GPU measurement support. | |
perf | --perf | false | Enable perf_event hardware counters. | |
rapl_backend | --rapl-backend | Perf | Choose RAPL backend: powercap or perf. | |
command | (subcommand) | (required) | The subcommand/program to execute and profile. |
The subcommand profile has also some arguments:
| Argument | Short | Long | Default | Description |
|---|---|---|---|---|
token_pattern | --token-pattern | __[A-Z0-9_]+__ | Regex to detect phase tokens in the program’s stdout. If the pattern contains a capture group, the captured text becomes the token name. Phases are computed between consecutive tokens (and from START/END). | |
stdout_file | -o | --stdout-file | None | Redirect the profiled program’s stdout to a file. |
rapl_polling | --rapl-polling | None | RAPL counter polling frequency, in seconds. |
The profiled command is provided after -- at the end of the arguments.
Sources Workspace
The Sources Workspace contains all metric source implementations (e.g., RAPL, perf_event, NVML, etc.). Each source is responsible for collecting a specific type of measurement data.
Metric sources are responsible for collecting raw measurement data and maintaining any internal state required for measurement. Sources never perform aggregation logic but provide functions to transform raw data to aggregated metrics at the end of the profiling.
Each source is isolated and independent from other sources and can be configured independently. This allows users to enable only the sources they need and makes it easy to add new ones.
The workspace is designed to support various sources, including built-in sources maintained by the project or user-defined sources. New sources can be added without modifying the core or the CLI, as long as they follow the expected interface.
Development Setup
This section explains how to set up a local development environment for Joule Profiler, build the project, run tests, and contribute effectively.
1. Prerequisites
Before starting, ensure you have the following installed:
System Requirements
- Linux OS (Ubuntu, Debian, Fedora, Arch, etc.)
- Intel or AMD CPU with RAPL support (most CPUs since Sandy Bridge in 2011 for Intel, and most since Zen architecture in 2017 for AMD)
- Root access (required to read RAPL counters with Powercap backend)
Software Dependencies
- rustc 1.70+ and cargo (official Rust installer recommended)
2. Build the Project
Build in release mode:
cargo build --release
This will produce the binary at:
target/release/joule-profiler
You can run it directly using:
./target/release/joule-profiler --version
For debug mode (faster building during development):
cargo build
./target/debug/joule-profiler --version
3. Run Tests
Run the full test suite with:
cargo test
For faster iteration during development:
cargo test --lib        # only library tests
cargo test --bins       # only binary/tests for CLI
cargo test --doc       # only doctests
cargo test -- --nocapture  # show test output
4. Formatting & Linting
Ensure code follows project style using rustfmt and clippy:
cargo fmt       # format code
cargo clippy    # lint code for warnings and suggestions
Note
Recommended to run these before committing changes and required for submitting pull requests.
5. Development Tips
- Use the
examples/folder to experiment with different scripts and phase token patterns. - Use logging flags (
-v,-vv,-vvv) for debugging purposes.
6. Notes
Note
- Energy measurements require Intel or AMD CPUs and Linux with the powercap framework or perf_event kernel module.
- Running programs under a virtual machine may give inaccurate readings due to limited access to RAPL counters.
- Root access is required for RAPL counters, but you can test some library functionality without root.
By following these steps, you’ll have a fully functional development environment for Joule Profiler and be ready to contribute or test new features.
Adding a Custom Source
Joule Profiler is built on a modular architecture designed for extensibility. This allows users to integrate new metric sources such as custom hardware sensors, software counters, or external APIs without modifying the core profiling engine.
Trait Implementation
To create a valid source for Joule Profiler, your struct must implement the MetricReader trait.
Some provided methods are optional.
See the source implementation example to understand with a minimal example how to implement a source.
pub trait MetricReader: Send + 'static {
    /// Type of metrics returned by the reader.
    type Type: MetricReaderTypeBound;

    /// Error type produced by the reader.
    type Error: MetricReaderErrorBound;

    //
    // Optional methods
    //

    /// Initialize the source before measurements.
    fn init(&mut self) -> impl Future<Output = Result<(), Self::Error>> + Send;

    /// Cleanup or join logic after measurements.
    fn join(&mut self) -> impl Future<Output = Result<(), Self::Error>> + Send;

    //
    // Mandatory methods
    //

    /// Perform a measurement and update internal state.
    fn measure(&mut self) -> impl Future<Output = Result<(), Self::Error>> + Send;

    /// Retrieve the current metrics snapshot.
    fn retrieve(&mut self) -> impl Future<Output = Result<Self::Type, Self::Error>> + Send;

    /// Return all sensors provided by this source.
    fn get_sensors(&self) -> Result<Sensors, Self::Error>;

    /// Convert a snapshot into Joule Profiler metrics.
    fn to_metrics(&self, result: Self::Type) -> Result<Metrics, Self::Error>;

    /// Return the static name of the metric source.
    fn get_name() -> &'static str;
}
Best Practices
When implementing a metric source, keep the measure method lightweight and fast; any heavy computation or data processing should be done in to_metrics to ensure measurements do not introduce overhead or slow down profiling.
How to Register a Source
Once a source is implemented, adding it to the profiler is straightforward. You simply instantiate your source and register it with the JouleProfiler instance before starting to measure.
use joule_profiler::JouleProfiler;
use my_custom_source::MySource;

#[tokio::main]
async fn main() {
    // 1. Create the profiler
    let mut profiler = JouleProfiler::new();

    // 2. Instantiate your custom source
    let my_source = MySource::new();

    // 3. Register the source
    profiler.add_source(my_source);

    // 4. Start profiling
    let results = profiler.profile().await.unwrap();

    // 5. Use the results as you need
}
Contributing to Joule Profiler
First off, thank you for considering contributing to Joule Profiler ! We welcome contributions of all kinds: bug reports, documentation improvements, examples, or new features.
By contributing, you agree that your contributions will be licensed under the MIT License.
How to Contribute
1. Reporting Issues
If you find a bug, unexpected behavior, or have a feature request:
- Check the GitHub repositoy issues to see if it has already been reported.
- Open a new issue with a clear description of:
- Steps to reproduce (if applicable)
- Expected behavior
- Observed behavior
- Environment (OS, CPU, GPU, Joule Profiler version, etc.)
- Provide examples
2. Suggesting Improvements
We love feedback on improving the project. You can suggest improvements via:
- Opening a GitHub issue labeled as
enhancement. - Sharing examples, documentation updates, or performance suggestions.
3. Code Contributions (Pull Requests)
If you want to contribute code:
- Make your changes in a branch in your fork.
- Ensure existing tests pass and add new tests if needed.
- Update documentation if your changes affect usage or examples.
- Open a pull request to the main repository.
- Reference or label related issues clearly in your PR.
Troubleshooting
Overview
Energy profiling operates at a low level, directly interfacing with hardware counters and kernel subsystems. This introduces several challenges:
- Hardware Dependencies: Energy counters (RAPL, perf_event) require specific CPU support and may be disabled in BIOS
- Privilege Requirements: Reading hardware counters typically requires elevated permissions or specific kernel configurations
- Measurement Sensitivity: Energy readings are affected by system state, background processes, and thermal conditions
- Platform Variations: Different CPUs, kernel versions, and system configurations expose metrics differently
Most issues stem from these fundamental constraints rather than bugs in the profiler itself.
See [common-issues](common issues.md) if you encounter an issue with the profiler and do not find it in the common issues, then please submit it on the GitHub repository and we will work on a solution.
Common Issues
Permission Denied
Problem: Cannot read RAPL counters or perf event.
Solutions: Run with root privileges when using powercap backend or configure perf_event_paranoid configuration for perf_event backend.
No RAPL Domains Found
Problem: No RAPL domains found.
This issue happens with powercap backend.
Check available sensors:
sudo joule-profiler list-sensors
Solutions:
- Update Linux kernel to 3.13+ (required for RAPL support)
- Check BIOS settings (some systems disable RAPL in firmware)
- Verify CPU supports RAPL (most Intel CPUs since Sandy Bridge, AMD since Zen)
- Try specifying custom RAPL path:
sudo joule-profiler --rapl-path /sys/class/powercap/intel-rapl phases -- ./my-program
High Variance in Measurements
Problem: Energy measurements vary significantly between iterations.
Why This Happens
Short Program Duration: For programs running under 100ms, measurement overhead and system noise become proportionally significant:
- Profiler initialization (spawning, pausing, counter attachment)
- OS scheduling decisions and cache state variations
- Hardware counter granularity relative to execution time
- It also depends on the hardware energy management, on laptops the variance is significantly higher than on desktop computers, due to the energy saving policies.
System Activity: Background processes, thermal throttling, and frequency scaling cause variations.
Solutions
# 1. Use multiple iterations to reduce variance
sudo joule-profiler sphasese -n 20 -- ./my-program

# 2. Enable logging to see warnings and diagnostics
sudo joule-profiler -vv phases -- ./my-program

# 3. Minimize background processes
# Close browsers, IDEs, file syncing, etc.

# 4. Disable CPU frequency scaling (optional, for more stable results)
sudo cpupower frequency-set --governor performance

# 5. Profile longer-running programs
# Extend your workload or loop it internally:
./my-program --repeat 1000
For Short Programs: If your program must run quickly, increase internal iteration count rather than relying on profiler iterations.
Tokens Not Detected (Phases Mode)
Problem: No phases computed, warning “No tokens matching pattern”.
Check with logging:
sudo joule-profiler -v phases -- ./my-program
Solutions:
Verify tokens are printed to stdout (not stderr):
# Correct (stdout)
print("__INIT__")

# Wrong (stderr)
import sys
print("__INIT__", file=sys.stderr)
Incorrect phases measures
Solution: Flush the stdout on each print, otherwise the prints will be buffered and the phases will be merged.
Example output without stdout flushing:
╔════════════════════════════════════════════════╗
║  Phase: START -> __WORK_START__                ║
╚════════════════════════════════════════════════╝
  Duration            :        109 ms
  Start token         :      START
  End token           : __WORK_START__ (line 1)

┌────────────────────────────────────────────────┐
│ RAPL (perf_event)                              │
└────────────────────────────────────────────────┘
  CORE-0              :    9317199 µJ
  DRAM-0              :     126281 µJ
  PACKAGE-0           :   10607910 µJ

╔════════════════════════════════════════════════╗
║  Phase: __WORK_START__ -> __WORK_END__         ║
╚════════════════════════════════════════════════╝
  Duration            :          0 ms
  Start token         : __WORK_START__ (line 1)
  End token           : __WORK_END__ (line 2)

┌────────────────────────────────────────────────┐
│ RAPL (perf_event)                              │
└────────────────────────────────────────────────┘
  CORE-0              :       5187 µJ
  DRAM-0              :          0 µJ
  PACKAGE-0           :          0 µJ
We can see that the WORK_START -> WORK_END phase is during 0ms, which is the longest running phase. To fix this issue, we need to flush the stdout on each print to avoid buffering:
# Python
print("__WORK_START__", flush=True)
# ... work ...
print("__WORK_END__", flush=True)
#![allow(unused)]
fn main() {
// Rust
println!("__WORK_START__");
use std::io::{self, Write};
io::stdout().flush().unwrap();
}
// C
printf("__WORK_START__\n");
fflush(stdout);
Which gives the following results:
════════════════════════════════════════════════╗
║  Phase: START -> __WORK_START__                ║
╚════════════════════════════════════════════════╝
  Duration            :         25 ms
  Start token         :      START
  End token           : __WORK_START__ (line 1)

┌────────────────────────────────────────────────┐
│ RAPL (perf_event)                              │
└────────────────────────────────────────────────┘
  CORE-0              :    2244689 µJ
  DRAM-0              :      43273 µJ
  PACKAGE-0           :    2518737 µJ

╔════════════════════════════════════════════════╗
║  Phase: __WORK_START__ -> __WORK_END__         ║
╚════════════════════════════════════════════════╝
  Duration            :         77 ms
  Start token         : __WORK_START__ (line 1)
  End token           : __WORK_END__ (line 2)

┌────────────────────────────────────────────────┐
│ RAPL (perf_event)                              │
└────────────────────────────────────────────────┘
  CORE-0              :    6755859 µJ
  DRAM-0              :      80505 µJ
  PACKAGE-0           :    7568481 µJ
Here, we can see that the WORK_START -> WORK_END has more accurate results due to stdout flushing.
Invalid Regex Pattern
Problem: Error “Invalid regex pattern”
Common mistakes:
# Wrong: unescaped special characters
--token-pattern "[INIT]"

# Correct: escape brackets
--token-pattern "\[INIT\]"

# Wrong: unclosed group
--token-pattern "(INIT"

# Correct: balanced parentheses
--token-pattern "(INIT)"
Solution: Test your regex pattern before profiling:
- Use online tools: https://regex101.com/
- Test with grep:
echo "your output" | grep -E "your-pattern"
Counter Overflow Warning
Problem: Warning about energy counter at 90%+ of max range on RAPL powercap backend.
Explanation: This is informational, not an error. Hardware energy counters have a maximum value before they wrap around. The profiler detects when counters approach this limit and handles overflow automatically.
Solution: This is normal for long-running systems or high power consumption. The measurement remains accurate - the warning is just informing you that internal counter wrapping was handled.
Missing Metrics
Problem: Expected metrics don’t appear in results.
Solutions:
- Verify your hardware supports the requested counters (e.g., RAPL, perf_event support)
- Check that metric sources are properly initialized (use
-vvfor detailed logging) - Ensure you have necessary permissions for the metric source
- List available sensors:
sudo joule-profiler list-sensors
High Overhead on Very Frequent Measurements
Problem: Profiler seems to slow down the program significantly
Cause: Too many phase transitions (measuring every few milliseconds)
Solution: Reduce measurement frequency:
- Use phases only for major sections (not every small operation)
- Batch work between phase tokens
- Aim for phases lasting at least 100ms each