perf_event
Overview
perf_event is the Linux kernel’s performance monitoring API that provides access to hardware, software and other like PMU supported counters.
It allows fine-grained measurement of low-level events such as CPU cycles, instructions retired, cache misses, branch mispredictions, context switches, PMU supported counters and more. These events can be used to analyze performance bottlenecks, execution efficiency, and in combination with hardware counters it can be used to help estimating energy and power-related insights.
The perf_event subsystem has been part of the Linux kernel since version 2.6.31 and is supported on most modern architectures, including x86, ARM, and RISC-V.
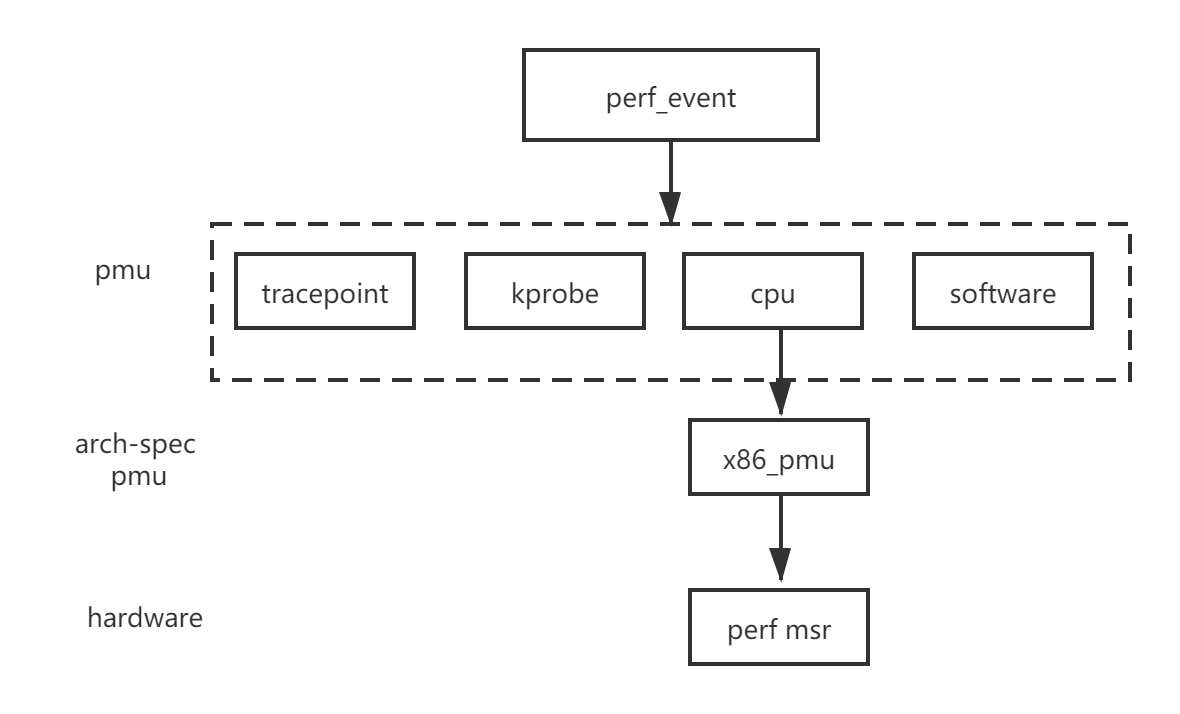
Architecture
The perf_event interface exposes a unified abstraction over multiple types of performance events. Events are collected by the kernel and accessed through the perf_event_open system call, which enables user-space tools to configure, start, stop, and read counters.
Events can be attached to a specific context like process, CPU core or control group, but Joule Profiler only supports per-process counters at the moment.
Event Types
perf_event supports several categories of events:
| Event Type | Description |
|---|---|
| Hardware | CPU-provided events such as cycles, instructions, cache references, and cache misses. |
| Software | Kernel-provided counters such as context switches, page faults, and CPU migrations. |
| Hardware Cache | Cache-specific events broken down by cache level, operation, and result. |
| Tracepoint | Kernel tracepoints for observing system-level behavior. |
| Raw | Architecture-specific events accessed via raw event codes. |
| PMU-specific | Events exposed by hardware-specific Performance Monitoring Unit (PMU) like RAPL counters |
perf_event event types:
Note
- The availability and accuracy of events depend on the underlying hardware PMU and kernel configuration.
- Access to certain events may require elevated privileges or relaxed kernel settings, see perf_event_paranoid.